Regional Payment Preferences Drive Variations in Virtual Table Adoption
Erik Zimmermann · Jul 21, 2026
Regional Payment Preferences Drive Variations in Virtual Table Adoption
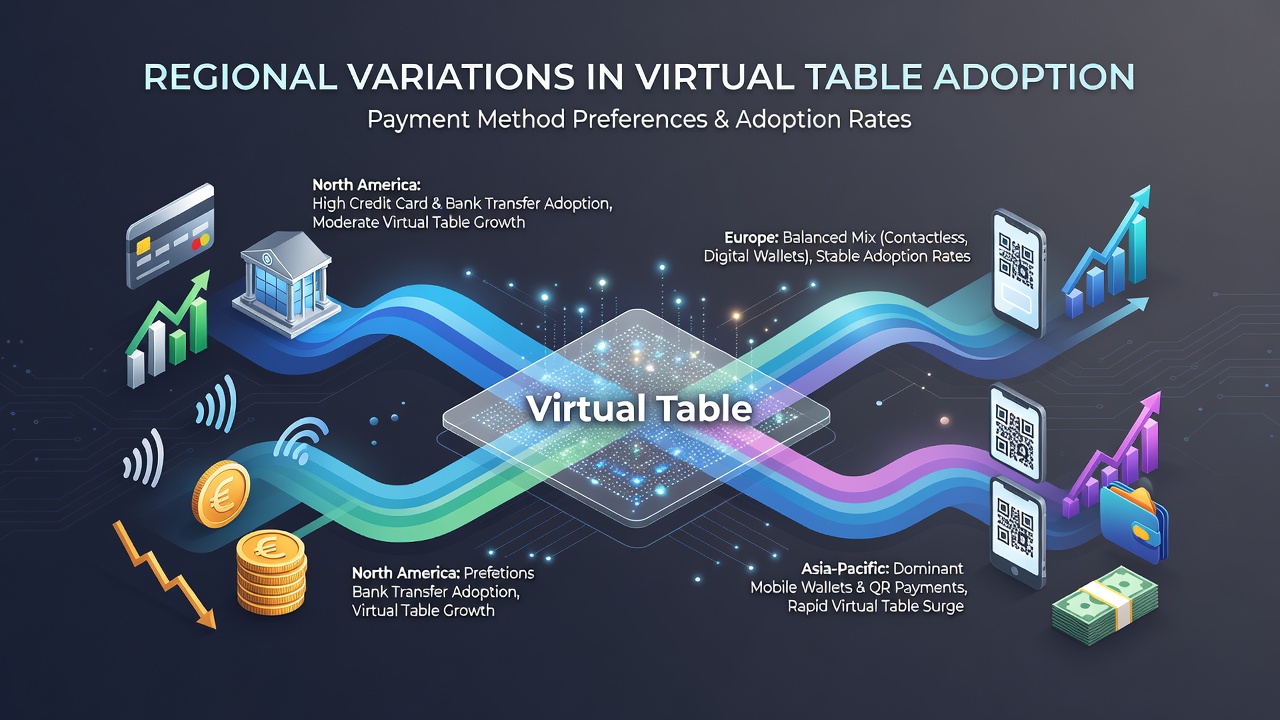
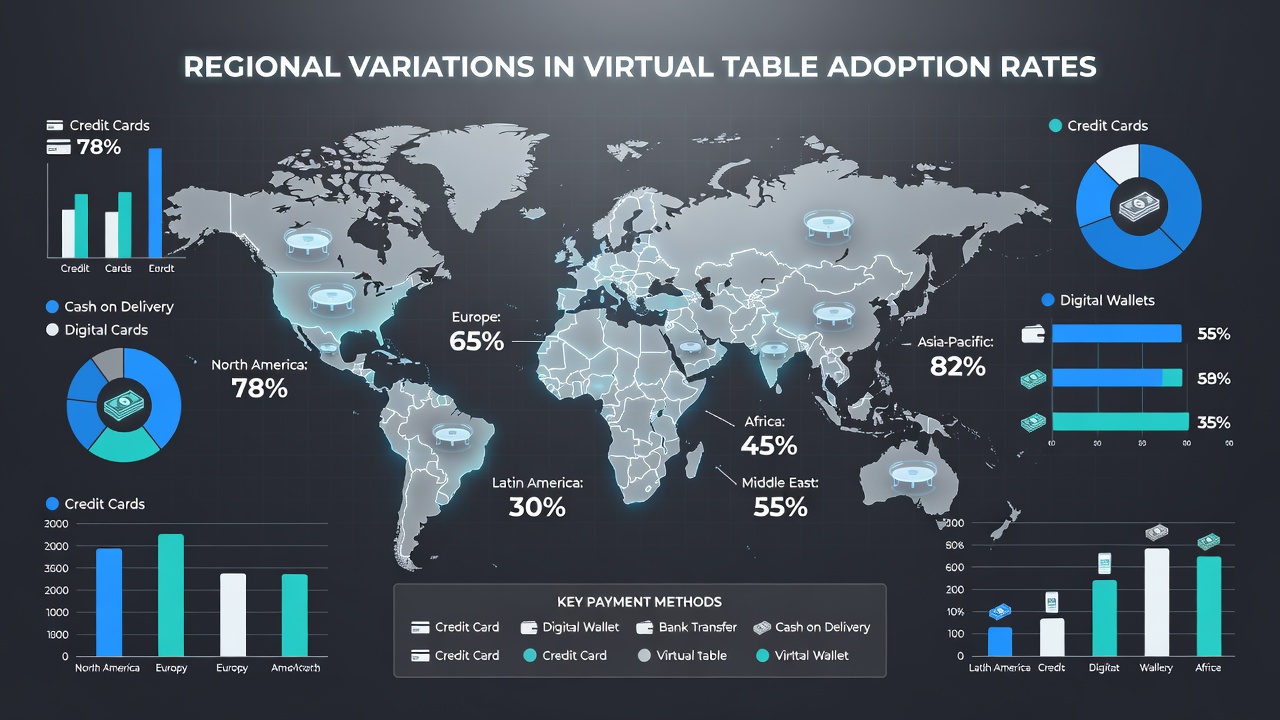
Payment method preferences continue to shape how players engage with virtual table games, and data from multiple markets shows distinct regional patterns emerging through 2026. Observers note that credit card usage remains dominant in North America while e-wallets and instant bank transfers lead adoption rates in parts of Europe and Asia, and these choices align closely with virtual table participation levels according to industry reports.
North American Patterns and Payment Habits
Research from Canadian regulators and state gaming bodies indicates that debit and credit cards account for over 60 percent of deposits in regulated markets, with virtual table games such as blackjack and roulette seeing steady uptake among users who prefer familiar banking rails. Studies released in July 2026 highlight that players in these regions often stick with established card networks because of seamless integration with existing financial apps, and this consistency supports higher session lengths on table products compared to slots or crash games.
Meanwhile, cryptocurrency options have gained limited traction in certain US states where legislation permits them, yet adoption remains concentrated among younger demographics who also show elevated interest in live dealer tables streamed to mobile devices. Those who've examined transaction logs across multiple operators report that crypto users complete more frequent but smaller bets on virtual tables, creating a distinct engagement profile that differs from card-heavy segments.
European and Asia-Pacific Contrasts
Figures from the European Gaming and Betting Association reveal that e-wallets and instant bank transfers now represent the majority of transactions in several EU markets, correlating with stronger virtual table adoption in countries where these methods dominate. Players using faster payout options tend to migrate toward table games that reward strategic play, and data collected through mid-2026 shows virtual roulette and baccarat tables experiencing the sharpest growth in these environments.
Shifting focus to Asia-Pacific markets, observers point to mobile-first payment solutions such as QR code transfers and digital wallets driving participation. A Statista analysis of transaction trends notes that regions with high mobile wallet penetration also report elevated virtual table session counts, particularly during evening peak hours when live dealer formats attract larger audiences.
Linking Payment Speed to Table Game Engagement
What's interesting is how transaction speed influences game selection across borders. In markets where instant deposits prevail, virtual tables often see repeat visits within the same day, whereas slower bank transfer regions record longer gaps between sessions. Researchers tracking player behavior through 2025 and into July 2026 found that payment friction reduces the likelihood of switching from slots to tables, and this pattern holds steady regardless of promotional activity.
One study released by an academic research group in Australia examined deposit method data alongside game logs and discovered that players favoring prepaid cards or vouchers showed lower virtual table conversion rates than those using integrated banking apps. The findings suggest that perceived control over spending and quick access to funds play measurable roles in shaping preferences for skill-oriented table products.
Regulatory and Market Influences
Different licensing frameworks also affect which payment rails operators can promote, and this in turn colors regional adoption statistics. Markets with strict know-your-customer rules tend to favor methods that already embed verification steps, while lighter regimes allow broader experimentation with emerging fintech solutions. Data collected across these varied environments shows virtual tables thriving where payment ecosystems align with player expectations for speed and security.
Industry organizations continue to monitor these intersections, and reports issued in 2026 underscore that payment preference data serves as a reliable predictor of table game performance in new jurisdictions. Operators who adapt their offerings to local payment norms record higher engagement on virtual tables compared with standardized approaches that ignore regional habits.
Conclusion
Payment method preferences reveal clear regional variations that directly influence virtual table adoption rates worldwide. From card-dominant North American markets to wallet-driven Asia-Pacific and Europe, the data illustrates consistent links between transaction convenience and table game participation. As markets evolve through 2026 and beyond, these patterns provide operators and analysts with measurable indicators for tailoring product strategies to local player behaviors.